This Report studies the changes in inequality and racial composition and segregation in each of the counties in the Southern California region over a 50 year period. Many of the graphs display changes over a 50 year period since 1970, and some reach back even further in time. Some key results of interest include:
- Orange County has gone from the least racial/ethnic mixing in 1970 to the most by 2018.
- Los Angeles County has the highest level of income inequality.
- Ventura County has the lowest level of income inequality.
- After rising in earlier years, income inequality in Orange County has held relatively steady since 2000.
- Income segregation is higher in Southern California counties compared to average U.S. large counties.
- Income segregation rose sharply in the 2000s, though it has fallen a bit since 2010.
- Incomes are rising fastest in San Diego County since 2000. Whereas the median income in San Diego County was 10% higher than the average large county in the U.S. in 2000, it was 30% higher by 2018.
- Incomes in Los Angeles County went from equal to the average large county in the U.S. in 2000 to 20% higher by 2018.
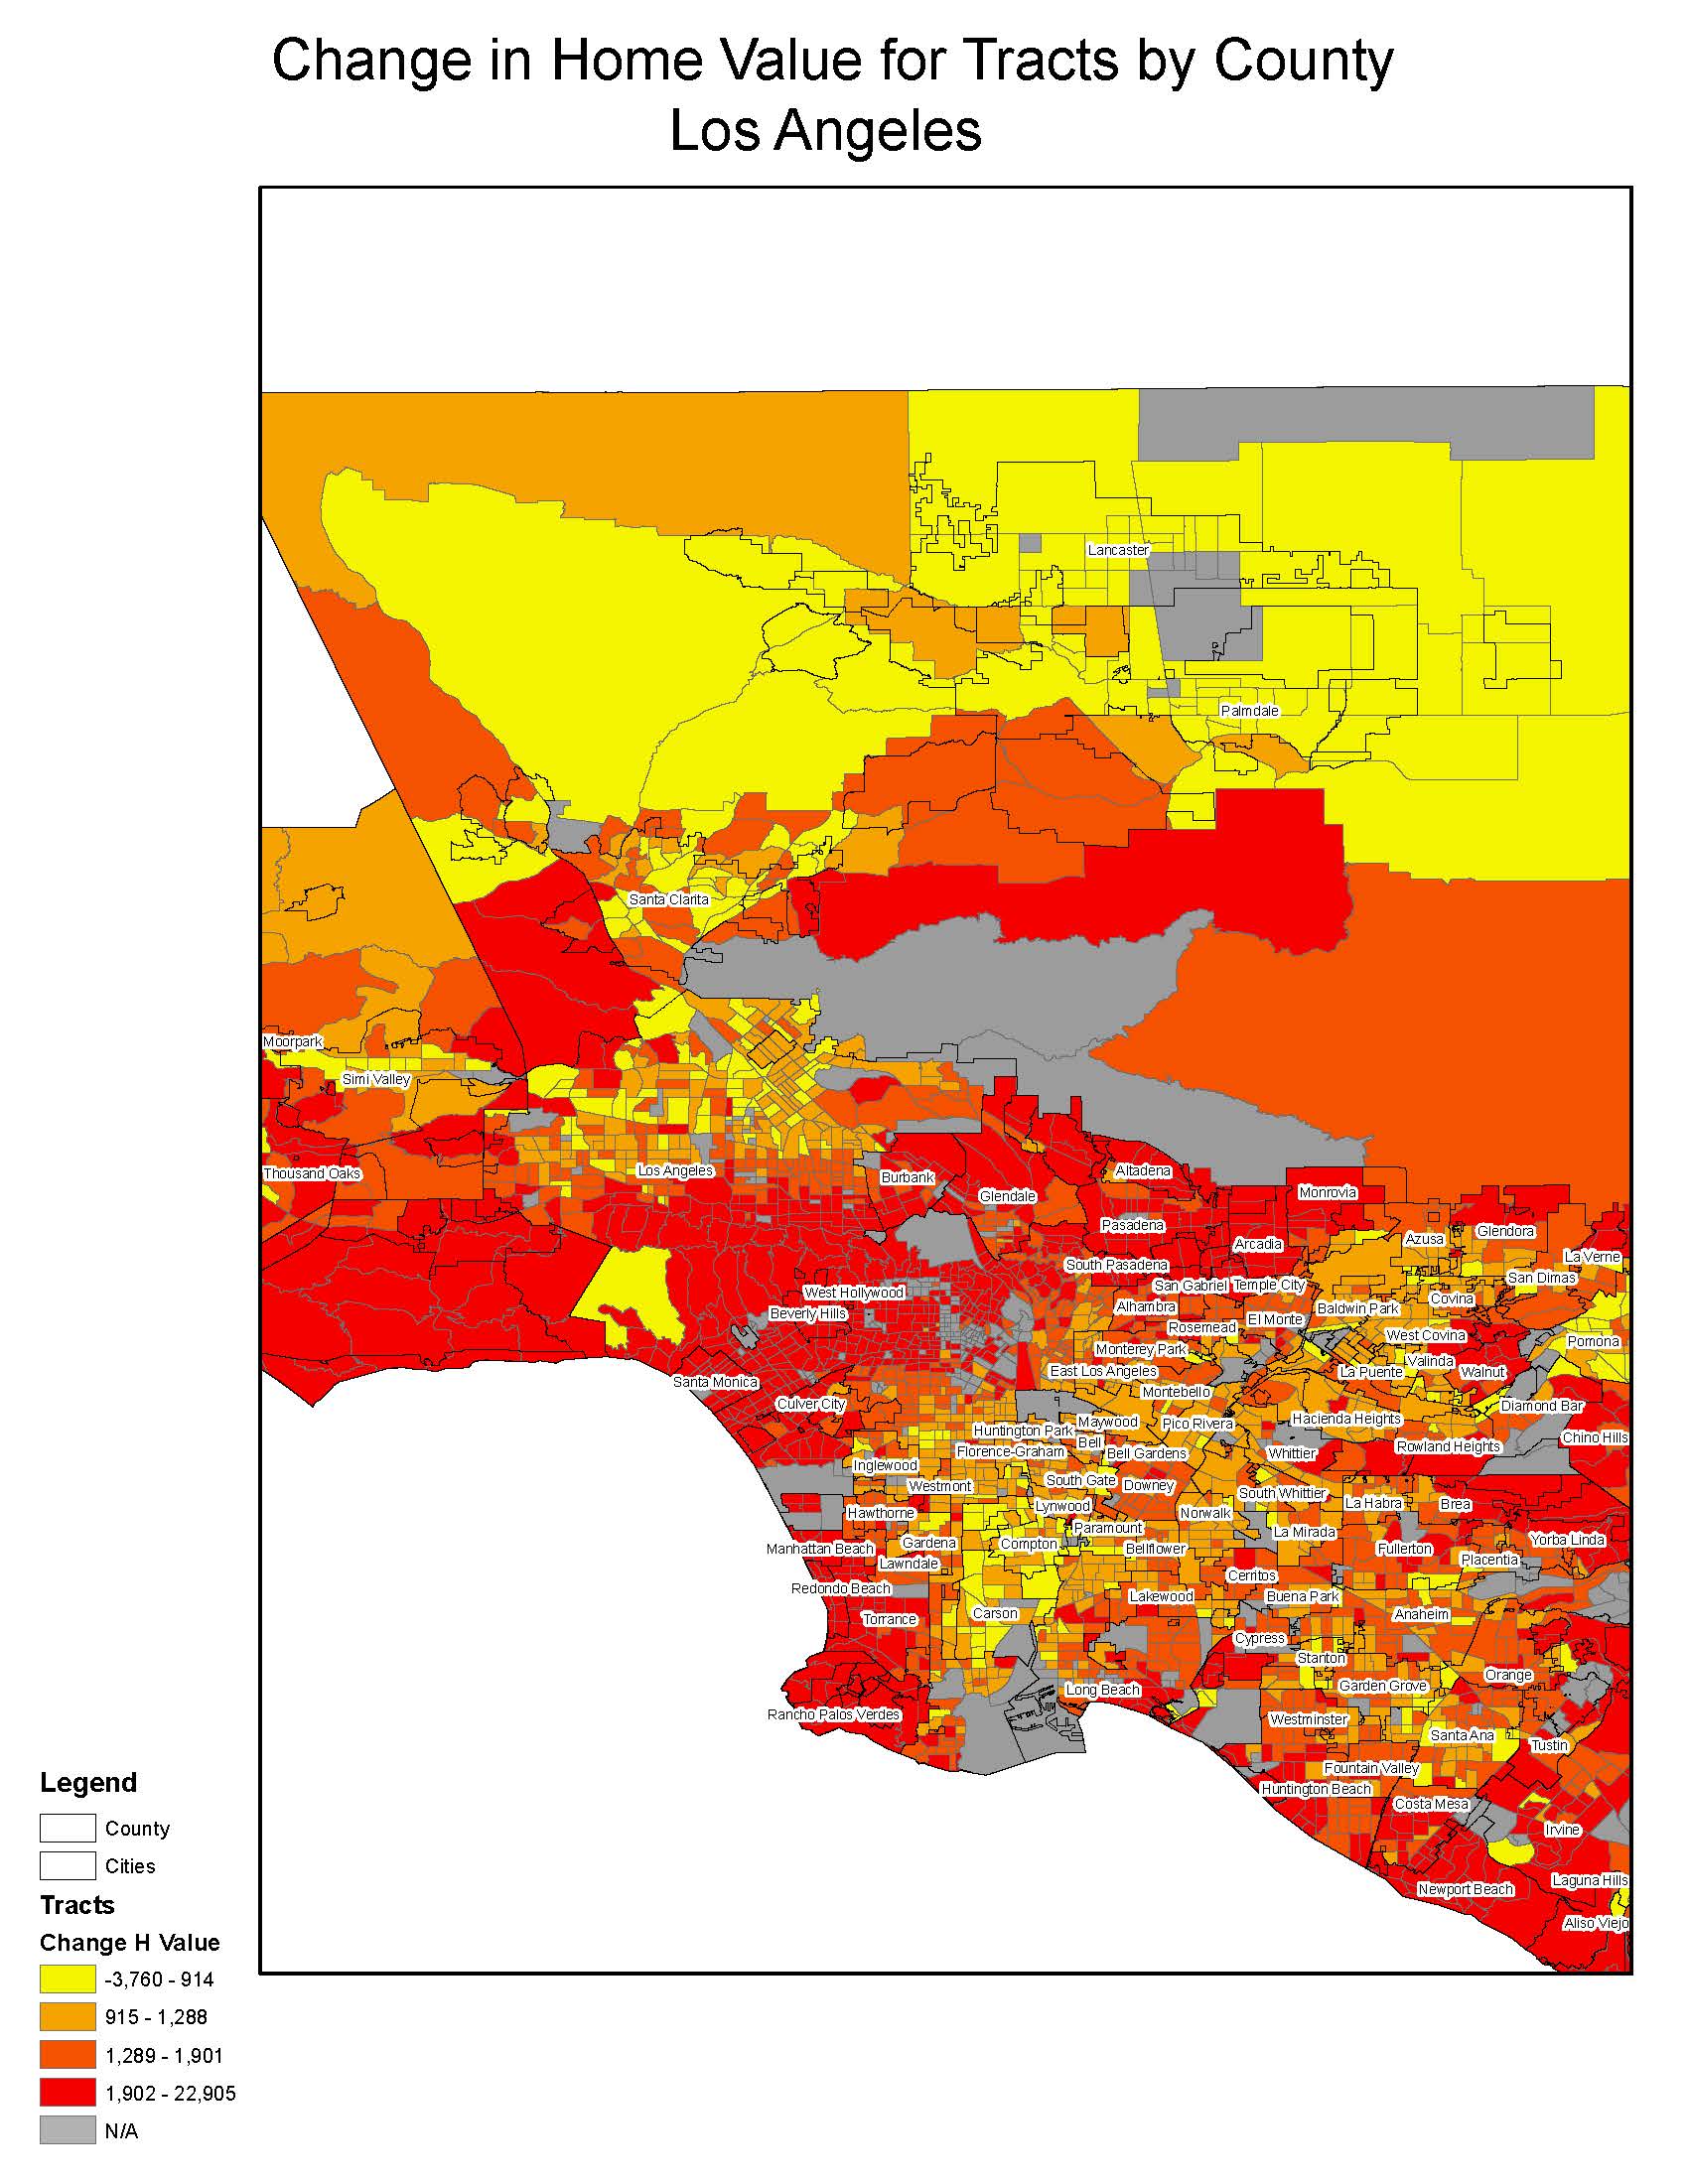
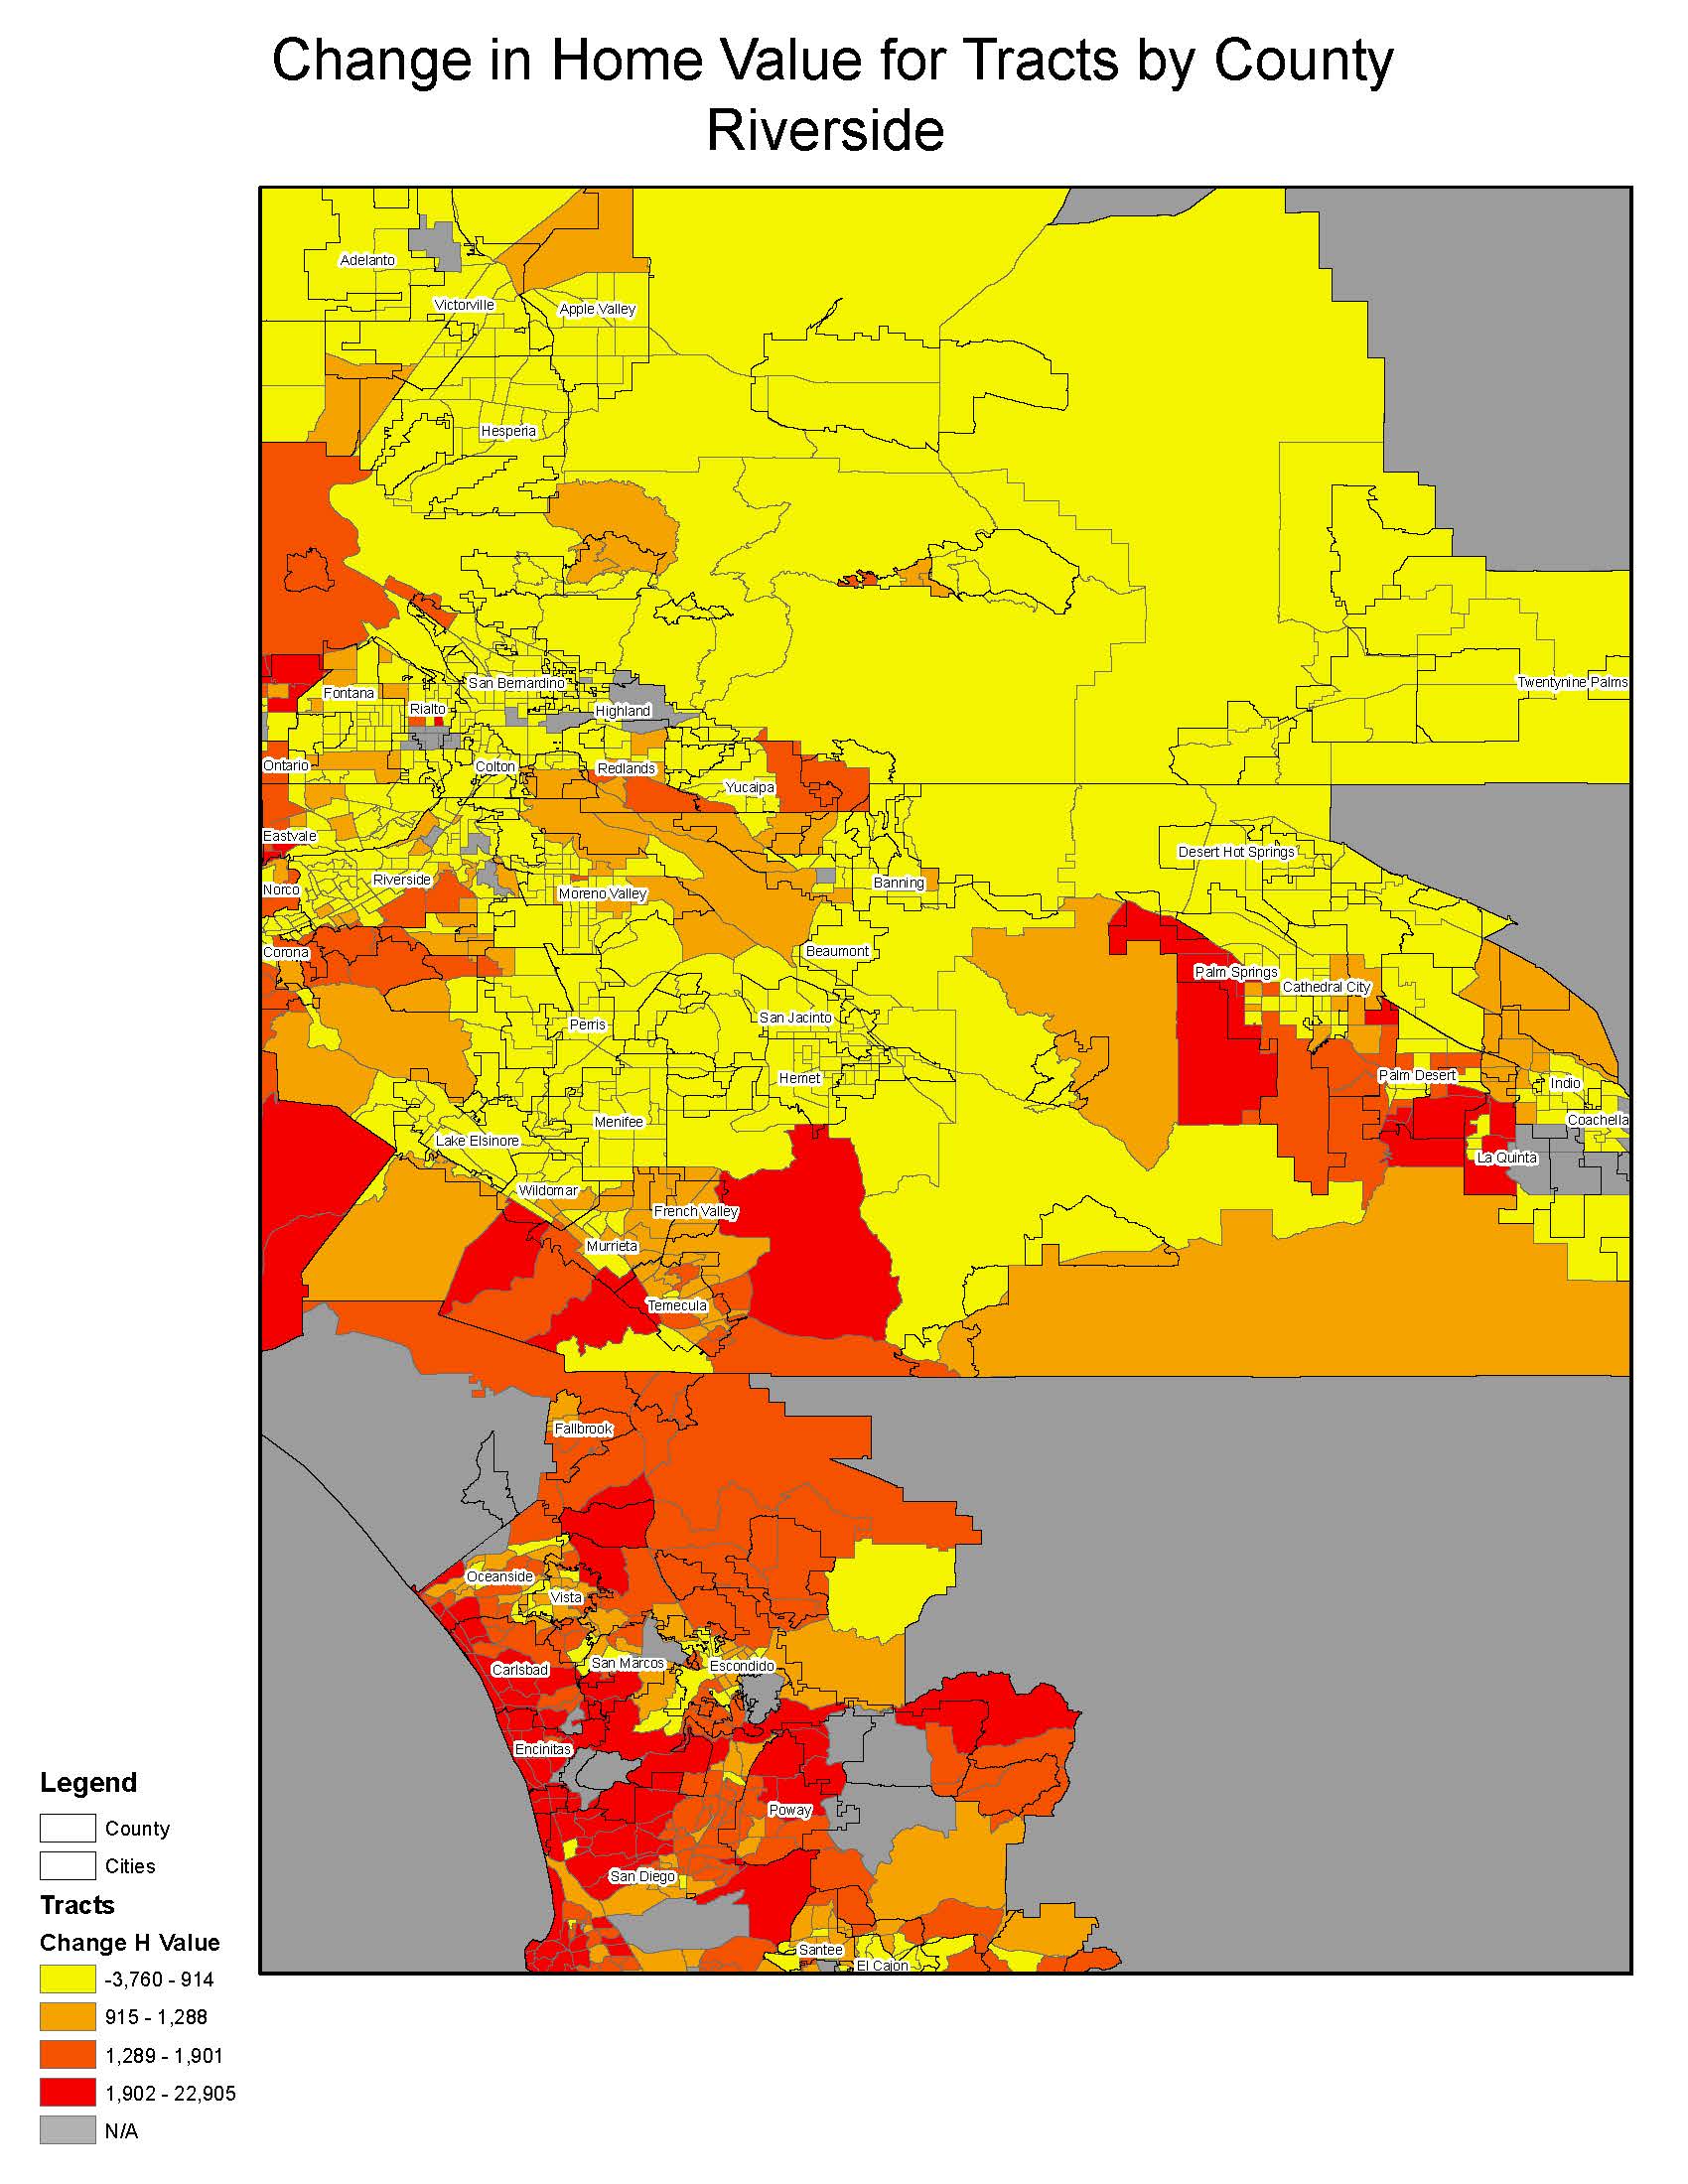
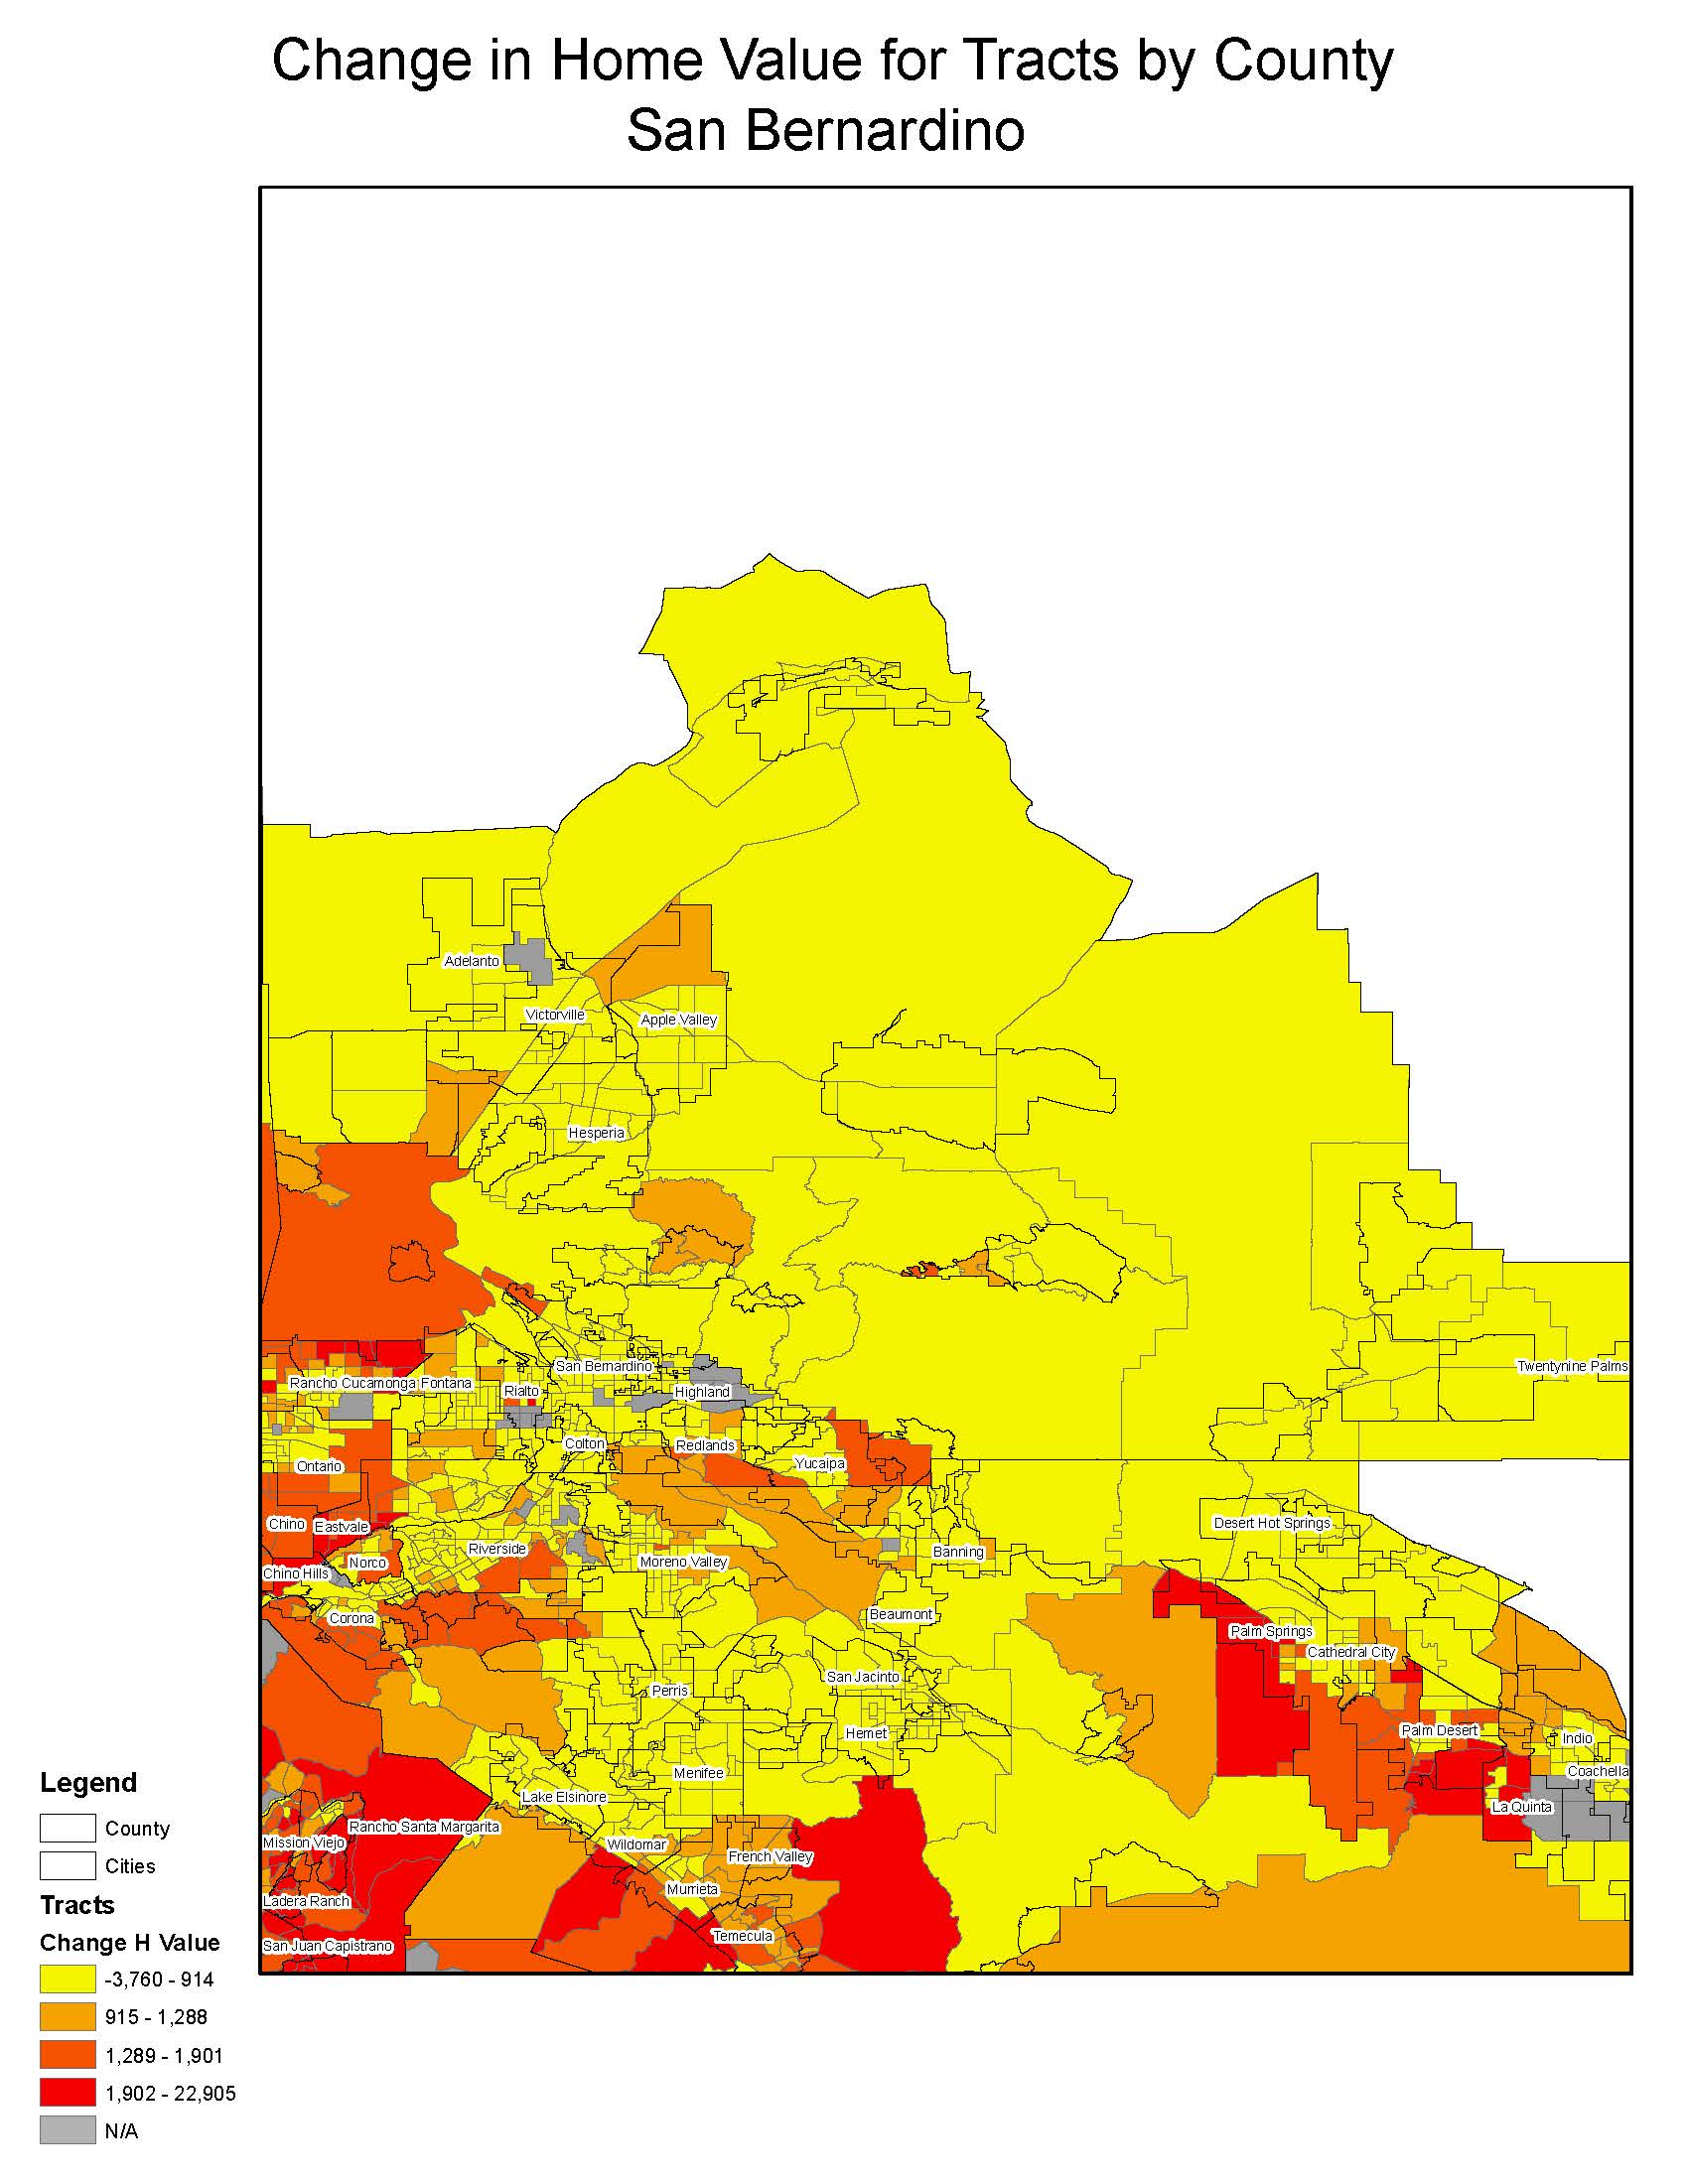
- Median rents and home values are rising faster in Southern California since 2000.
- In 2018, whereas the median income in Orange County is 50% higher than the average large county in the U.S., median rents are 90% higher, and median home values are 210% higher.
The maps here show which neighborhoods have experienced the largest increase in adjusted home values since 1970 for each of the counties.