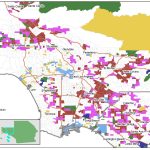
 For our analyses, we use data from 5 U.S. Censuses: 1960, 1970, 1980, 1990, 2000; as well as the American Community Survey (ACS) 5-year data in 2005-09 and 2011-15. We adopt a statistical approach that allows us to create a typology of how neighborhoods change based on their home values over time. Our analyses yielded 16 different classes of neighborhoods. In this Report, we will describe these classes of
neighborhoods based on their demographic composition over this period, and where they are located spatially.
The plan of the Report
In Chapter 2, we provide an overview of our data and analysis. We then give an overview of the 16 classes that were found in our analyses.
In Chapter 3, we describe each of the 16 neighborhood types based on their socio-demographic characteristics. We describe how each of these 16 classes of neighborhoods have changed over this period based on a number of socio-demographic measures.
In Chapter 4, we show the geographic distribution of these classes of neighborhoods by presenting a series of maps. In Chapter 5, we conclude and discuss the implications of our study.
In the Appendices, we present the profile of neighborhood types that exist in each of the cities in the region. That is, what percentage of neighborhoods in a city is classified into each class in our typology? We also present the profile of neighborhood types that exist in each of the zip codes in the region. Our neighborhoods (census tracts) are smaller than zip codes, and thus a zip code will be composed of several neighborhoods.
Download the full Report here.