Read the Report on Irvine at 50: The changing landscape of housing, commuting, and amenities

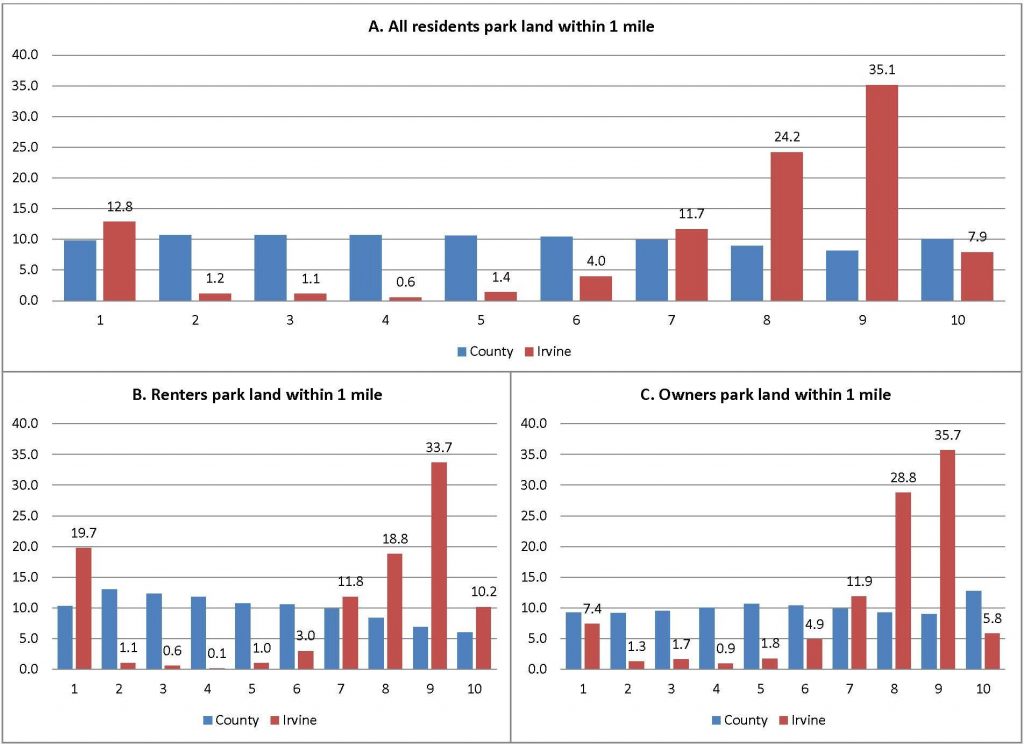
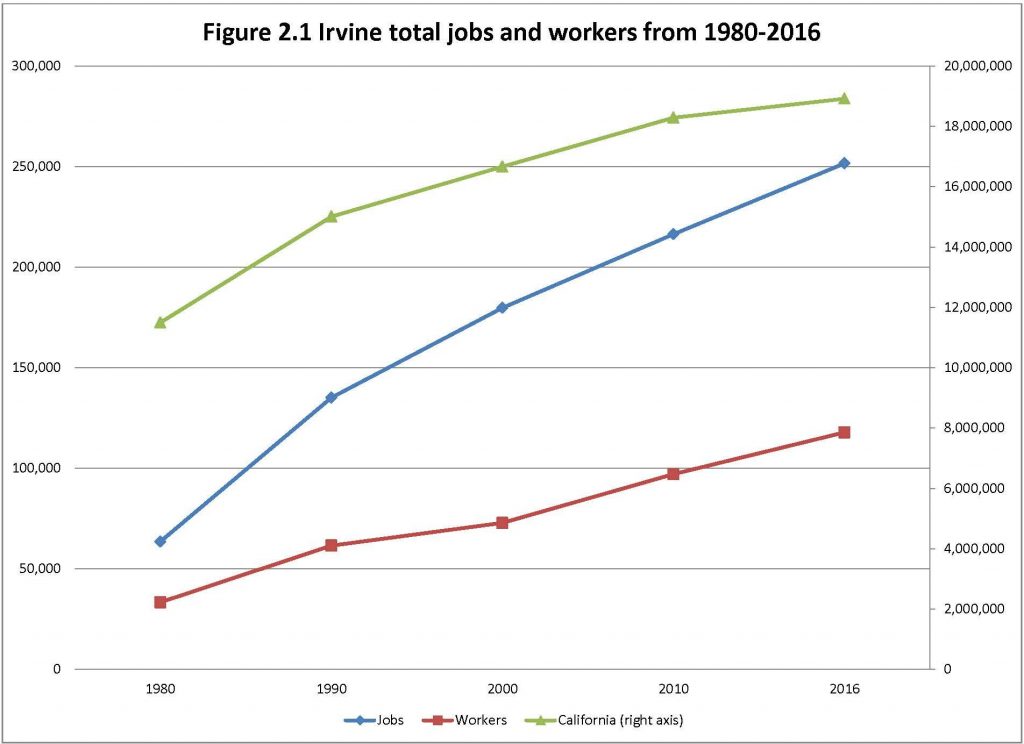
This MFI report presents how Irvine has matured and transformed over the last several decades. The present report pays close attention to the city’s residents and their living environment (or the quality-of-life metrics). In Chapter 2, we explore the growth of Irvine’s boundaries and its villages. In Chapter 3 we describe the types of housing in Irvine, whether detached single family units, condominiums and townhomes, or various sized apartment complexes. Given these housing patterns, and the presence of so many jobs in Irvine, in Chapter 4 we explore the commuting patterns of residents in the city—both based on distance and time, as well as mode of commute—and compare them to the rest of the region. A feature of Irvine is the presence of many parks along with the small commercial districts in the Village model that the city has followed, and therefore in Chapter 5 we ask whether Irvine residents indeed live closer to parks and commercial areas compared to residents in the rest of the region. Chapter 6 will describe the demographic changes that have occurred within the neighborhoods of Irvine over its history. Finally, Chapter 7 will conclude by summarizing what we have learned in this Report, and consider what the future of Irvine might look like.

Download full Report here

Read the Report on Irvine at 50: From a Planned Community to a Growing Job Center

This MFI Report presents the evolution of Irvine with a focus on its function as a job center. Although Irvine is well-known as a planned community with villages allowing for a comfortable suburban lifestyle, it nonetheless functions as a large job center to a degree that might surprise many people. Since 1980, it has retained the highest jobs/workers ratio in the Southern California region while also experiencing the fastest job growth in professional service industries throughout the region, particularly in computing and engineering occupations. As a consequence, the city has a much higher composition of high income jobs compared to the region—about 70% to 90% more than the region overall—and therefore fewer low and average income jobs.  We explore how Irvine has grown and transformed over the last 50 years with a focus on the number and types of jobs that are located in the city. We also describe where the workers in these jobs are coming from. 

Download the entire Report here.

Read the Report. Irvine at 50: A Tale of Continuity and Change

The city of Irvine has experienced significant change over its 50-year history, and yet one constant is that crime has remained at a low level, and, if anything, has been declining in the most recent decade. Why is that? In this report, we explore some of the possible factors that may help account for this phenomenon. Although Irvine contains some characteristics that criminologists typically identify in cities with higher crime rates–such as population growth, racial and ethnic diversity, a relatively high concentration of rental housing units, and the presence of a large industrial area–nonetheless, the city has maintained a relatively low level of crime. In fact, for 15 straight years Irvine has been named America’s safest city of its size, based on FBI Uniform Crime Reporting statistics from 18,000 jurisdictions.

Read this Report prepared by the Irvine Lab for the Study of Space and Crime (ILSSC), a subsidiary of the MFI. You can download the pdf here.

Read the Report on Where the Highly Educated are Moving in California

This Report explores residential mobility patterns among residents of California counties across four decades: 1985-90; 1995-2000; 2005-09, and 2015-19.  We focus explicitly on highly educated residents (those with at least a Bachelor’s degree), and where they are moving to and from.

Download the full Report as high resolution here.

Download the full Report as low resolution here.

Quarterly Report on Where the Highly Educated are moving in California

This Report explored residential mobility patterns among residents of California counties across four decades: 1985-90; 1995-2000; 2005-09, and 2015-19.  We focused explicitly on highly educated residents (those with at least a Bachelor’s degree). We also explored in more depth the mobility within southern California counties by these highly educated residents. Some key results:

  • Comparing in-movers to out-movers, in 2019 Imperial County has the highest ratio with nearly twice as many in-movers as out-movers with high education.  This was not the case in earlier decades. 
  • Imperial, Madera, and Napa counties had the largest relative inflow of young highly educated residents in 2019. .
  • Humboldt County in the northwest and San Luis Obispo County along the central coast have consistently experienced a relative outflow of young highly educated residents. .
  • Ventura and San Diego Counties have consistently received a relative inflow of older highly educated residents. 
  • Orange County has consistently experienced a relative inflow of middle-aged highly educated residents. They have also received a relative inflow of younger highly educated residents, though this is weaker in the two most recent decades. 
  • San Bernardino County has consistently experienced an overall relative outflow of highly educated residents.  
  • Riverside has consistently received the largest inflow of older highly educated residents compared to the rest of the region. They also received a relative inflow of middle-aged highly educated residents during the 2000s, but not in other decades. 
  • Los Angeles County has consistently experienced the strongest relative inflow of young highly educated residents.  
  • Los Angeles County experienced a relative outflow of older highly educated residents in earlier decades, but this has improved more recently.
  • Orange County has consistently experienced one of the largest relative inflows of Asian highly educated residents over time.
  • San Bernardino County has consistently experienced a relative outflow of White highly educated residents.
  • Los Angeles County has experienced a relative inflow of Black highly educated residents in recent decades. 
  • Ventura County has consistently experienced one of the largest relative inflows of Latino highly educated residents over time.

Read the Report here.

Quarterly Report on Inequality and Segregation in Southern California

This Report studies the changes in inequality and racial composition and segregation in each of the counties in the Southern California region over a 50 year period.  Many of the graphs display changes over a 50 year period since 1970, and some reach back even further in time.  Some key results of interest include:

  • Orange County has gone from the least racial/ethnic mixing in 1970 to the most by 2018.
  • Los Angeles County has the highest level of income inequality.
  • Ventura County has the lowest level of income inequality.
  • After rising in earlier years, income inequality in Orange County has held relatively steady since 2000.
  • Income segregation is higher in Southern California counties compared to average U.S. large counties.
  • Income segregation rose sharply in the 2000s, though it has fallen a bit since 2010.
  • Incomes are rising fastest in San Diego County since 2000. Whereas the median income in San Diego County was 10% higher than the average large county in the U.S. in 2000, it was 30% higher by 2018.
  • Incomes in Los Angeles County went from equal to the average large county in the U.S. in 2000 to 20% higher by 2018.
  • Median rents and home values are rising faster in Southern California since 2000.
  • In 2018, whereas the median income in Orange County is 50% higher than the average large county in the U.S., median rents are 90% higher, and median home values are 210% higher.

Read the Report here.

The maps here show which neighborhoods have experienced the largest increase in adjusted home values since 1970 for each of the counties.

Read the Report on Inequality and Segregation in Southern California

This Report studies the changes in inequality and racial composition and segregation in each of the counties in the Southern California region over a 50 year period.  Many of the graphs display changes over a 50 year period since 1970, and some reach back even further in time.  Some key results of interest include:

  • Orange County has gone from the least racial/ethnic mixing in 1970 to the most by 2018.
  • Los Angeles County has the highest level of income inequality.
  • Ventura County has the lowest level of income inequality.
  • After rising in earlier years, income inequality in Orange County has held relatively steady since 2000.
  • Income segregation is higher in Southern California counties compared to average U.S. large counties.
  • Income segregation rose sharply in the 2000s, though it has fallen a bit since 2010.
  • Incomes are rising fastest in San Diego County since 2000. Whereas the median income in San Diego County was 10% higher than the average large county in the U.S. in 2000, it was 30% higher by 2018.
  • Incomes in Los Angeles County went from equal to the average large county in the U.S. in 2000 to 20% higher by 2018.
  • Median rents and home values are rising faster in Southern California since 2000.
  • In 2018, whereas the median income in Orange County is 50% higher than the average large county in the U.S., median rents are 90% higher, and median home values are 210% higher.

Download the full report here.

The maps here show which neighborhoods have experienced the largest increase in adjusted home values since 1970 for each of the counties.

Appendices with the additional maps for each county separately from the Report are here:

Maps for Los Angeles County.

Maps for Orange County.

Maps for Riverside County.

Maps for San Bernardino County.

Maps for San Diego County.

Maps for Ventura County.

Read the Report on Rising Inequality and Neighborhood Mixing in Metropolitan Areas

Full Income map

This Report provides new insights into some of the spatial relationships involved in both neighborhood mixing and regional inequality through an investigation of 381 metropolitan areas in the U.S. in 2010 using advanced measurement strategies and analysis methods.

The study uses a novel neighborhood unit—egohoods—to measure the degree of mixing that occurs within the neighborhoods of these metropolitan areas.  It measures mixing based on income, occupational status, and educational achievement.

We compare the level of mixing on these three dimensions across all metropolitan areas in the U.S. in 2010.

Below is a map showing the level of income mixing in neighborhoods for each of the metropolitan areas in the U.S.

Full Income map

Download the full report here.

Quarterly Report on Rising Inequality and Neighborhood Mixing in Metropolitan Areas

Full Income map

This Report provides new insights into some of the spatial relationships involved in both neighborhood mixing and regional inequality through an investigation of 381 metropolitan areas in the U.S. in 2010 using advanced measurement strategies and analysis methods.

The study uses a novel neighborhood unit—egohoods—to measure the degree of mixing that occurs within the neighborhoods of these metropolitan areas.  It measures mixing based on income, occupational status, and educational achievement.

We compare the level of mixing on these three dimensions across all metropolitan areas in the U.S. in 2010.

Below is a map showing the level of income mixing in neighborhoods for each of the metropolitan areas in the U.S.

Quarterly Report on Typology of Southern California neighborhood home values from 1960-2015

MFI Quarterly Report: Typology of Southern California neighborhood home values

For many households, a home is their largest investment. In addition, for households much of their lives are lived within the neighborhood that contains their house. For these reasons, and many others,
there is naturally an interest in understanding the pattern of home value appreciation, or depreciation, across neighborhoods over time. We explore the change in home values across Southern California neighborhoods over a 50 year period.

For our analyses, we use data from 5 U.S. Censuses: 1960, 1970, 1980, 1990, 2000; as well as the American Community Survey (ACS) 5-year data in 2005-09 and 2011-15. We adopt a statistical approach that allows us to create a typology of how neighborhoods change based on their home values over time. Our analyses yielded 16 different classes of neighborhoods. In this Report, we will describe these classes of neighborhoods based on their demographic composition over this period, and where they are located spatially.

Download the full report here.